Climate change on the Antarctic Peninsula | Glacier fluctuations on James Ross Island | Glacier modelling experiments | Summary and conclusions | Further reading |
Modelled glacier response to centennial temperature and precipitation trends on the Antarctic Peninsula
This article is a summary of the following paper:
Read the Press Release.
Climate change on the Antarctic Peninsula
It’s getting snowier on the Antarctic Peninsula. Glaciers are thickening in their accumulation centres, but are melting more and thinning in their lower portions. Snowfall is forecast to continue to increase over the next couple of decades, so what does this mean for glaciers on the Antarctic Peninsula? Will the increase in snow offset glacier melt?
We studied this phenomenon on James Ross Island, northern Antarctic Peninsula. Here, summer temperatures can reach above 0°C and glaciers are melting strongly. In 1995 AD, Prince Gustav Ice Shelf collapsed, which resulted in glacier acceleration, recession and thinning, which continues to this day.
We carried out extensive fieldwork on James Ross Island to map and analyse the changes to a glacier, which is currently 4km long, over the past 10,000 years. We used a combination of glacier and climate modelling, glacial geology and ice-core data. We found that small glaciers that end on land around the Antarctic Peninsula are highly vulnerable to slight changes in air temperature. Over the next few decades, they will be smaller than at any point during the last 10,000 years. Just small increases in air temperature increased melting so much that even large amounts of extra snowfall could not prevent glacier recession. These small glaciers around the Antarctic Peninsula are likely to contribute most to rising sea levels over the coming decades, because they can respond quickly to climate change.

Glacier fluctuations on James Ross Island
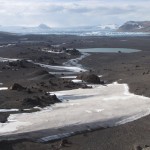
James Ross Island is well studied, being reasonably accessible by ship. There is a high resolution ice core, taken in 2007 AD, available from the summit of the Mount Haddington Ice Cap. The Ulu Peninsula is one of the largest ice-free areas in the region, which makes it ideal for glacial geological studies of past ice-sheet extent. Here, a large boulder train extends from Glacier IJR45 towards Brandy Bay, where it aligns with a large moraine. This moraine overlies reworked marine sediments with shells, which have been dated to ~5000 years ago. Because the shells are underneath the moraine, this suggests that the readvance that deposited the boulder train and the moraine occurred AFTER ~5000 years ago.

The ice-core temperature records from Mulvaney et al. (2012) tell us that the air temperatures on James Ross Island 5000 years ago were about 0.5°C warmer than today. Prince Gustav Ice Shelf was absent from ~6000 to 2000 years ago, during this relatively warm period. Ice shelf absence is usually indicative of strong surface melt.

Warm air usually carries more water, so a readvance may have occurred because there may have been more precipitation at this time. People have therefore hypothesised that the glacier readvanced during a period that was WARMER but WETTER than today, in response to increased snowfall. This behaviour is contrary to that observed today, with glacier recession during a period of warming and ice-shelf collapse. This readvance is therefore a good analogue for future glacier behaviour in this sensitive region.


Glacier modelling experiments
We used a computer numerical model to test these hypotheses of glacier behaviour. The glacier flowline model was calibrated and tested using the temperature and precipitation ice-core record over the last 160 years. The glacier flowline model (along line A-B in the Ulu Peninsula map) was calibrated and tested using the temperature and precipitation ice-core record over the last 160 years. The modelled glacier replicated rates of recession from 1970 AD to present, and finished in 2006 with a similar geometry and velocity to the observed glacier in 2006 AD, thus increasing confidence in our model.

Sensitivity experiments
We conducted a number of sensitivity experiments on the glacier model, including precipitation (snowfall), temperature, how easily snow and ice melt (snow and ice degree day factors), and how much the glacier ice deforms and slides (flow enhancement coefficient, sliding factor). The results are shown in the plots below. You can see that for a small decrease in temperature there is a very large increase in glacier length and volume, but there are only small changes for a +20% to -20% change in precipitation, degree day factors or the ice deformation factor.
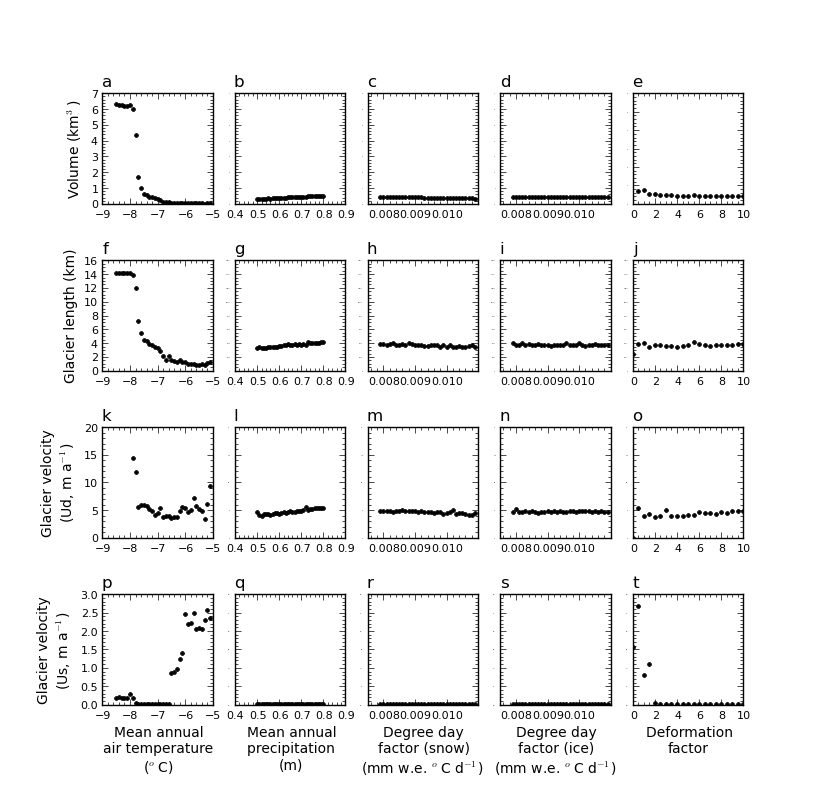
The profiles below show just how different the length changes are between temperature and precipitation sensitivity experiments.

Holocene simulations
The next stage was to use the Holocene climate record to drive the glacier through the last 10,000 years. Snowfall data are unavailable for this length of time. At first, we kept precipitation constant at modern values (0.65 m per year). This resulted in a fairly stable glacier for most of the Holocene, with a small retreat from 6000-2000 years ago, when Prince Gustav Ice Shelf was absent, and a large readvance out to the bay and Brandy Bay Moraine in the last millennium.
To test the hypothesis that it was a warmer but WETTER climate that forced a readvance 5000 years ago, we varied precipitation with temperature. We varied it by 5%, 7.3%, 15%, 20% and 100%, so that for every 1°C of warming, it became 5%, 7.3% (etc.) wetter. We were feeding the glacier during warm periods and starving it during cool periods.
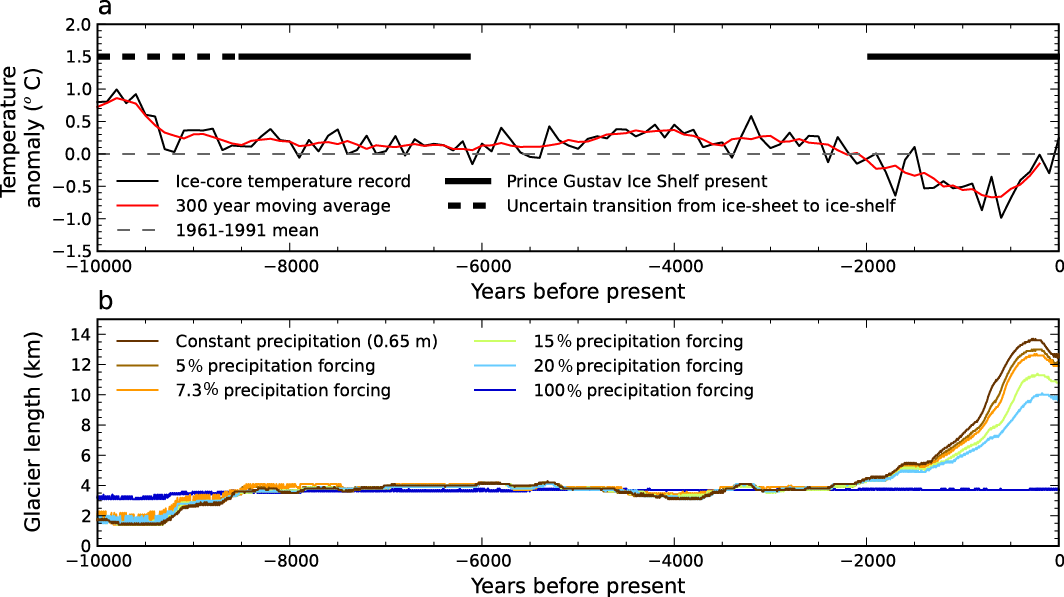
You can see from the figure (b) above that all this did was successively dampen the glacier’s response to cooling and warming. The readvance occurred at the same time, but was smaller according to amount of precipitation was reduced by. You can see this happening in profile view in the animation below.
These modelling experiments show that the glaciers on Ulu Peninsula remained largely stable for most of the Holocene, with likely recession during the period of ice-shelf collapse (6000-2000 years ago), and a large readvance during climatic cooling 1500-300 years ago, when the ice-shelf reformed. The glacier then receded rapidly in response to warming temperatures. The ice shelf collapsed again in 1995 AD, and the glacier continues to retreat today. This modelled behaviour is therefore more in line with current glacier observations.
We surmise that the readvance occurred during the Neoglacial, or “Little Ice Age” period, and not during the warmer period ~5000 years ago. Evidence for this is patchy, and there are few terrestrial records of ice advance at this time. Our study is the first to convincingly show glacier advance during a period of strong cooling during the last millennium. This research also suggests that, rather than being more extensive during warm periods in the past, glacier minima similar to present have occurred multiple times during the last 10,000 years.
Future simulations
To assess the significance of these findings within the context of future climate change, we performed simulations from 1980 to 2200 AD, with climate outputs from regional climate models. All four scenarios used predict temperature rises over the region for the next two hundred years, but projections of snowfall vary.
All four experiments predicted a strong decrease in glacier volume over the next two centuries. Glacier volume reaches minima not experienced at any point in the last 10,000 years within the next century, and the glacier has almost disappeared after 200 years.

Summary and conclusions
Glacier IJR45 is typical of many of the small, land-terminating glaciers peripheral to the Antarctic Peninsula, where surface melting is strongly controlled by air temperature and the length of the melt season. Both of these are projected to increase over coming decades, and summer melting will become increasingly important. These glaciers will therefore contribute significantly to sea level rise over coming decades to centuries. These processes are likely to be representative of regional glaciers.
Our main conclusions are:
- Glacier modelling, spanning a range of past, present and future time intervals, shows that Glacier IJR45 has a high sensitivity to temperature and is less sensitive to precipitation.
- Glacier advance during past and future warm periods is unlikely. Increases in precipitation on the Antarctic Peninsula will not offset glacier melting and recession.
- The most recent advance of the glacier likely occurred during the last millennium, peaking at ~300 years ago, during a period of strong cooling.
- The currently observed trends of glacier melting, thinning and recession around the Antarctic Peninsula will continue over coming decades to centuries, with glacier minima not experienced at any time over the last 10,000 years occurring within the next century.
Citation:
Please read the original article and cite as:
Further reading
- Climate change
- Glaciers and climate change
- Antarctic Peninsula glacier change
- Glacier mass balance
- Ice shelf collapse
- Prince Gustav Ice Shelf
- Glacier modelling
- Ice-cored moraines on Ulu Peninsula, James Ross Island
- Sediment-landform assemblages on Ulu Peninsula, James Ross Island
- Palaeo ice sheet reconstruction
Small cooling and stability.
As usual: begin from the end: it melts, and we are sure, that the temperatures somehow acts more than through 1 degree per century. Why glassers melt?
Thanks to the terrific manual
x